


Key takeaways:
- Webinar ROI is measured by assigning a real dollar value to outcomes (like direct sales and qualified leads) and tracking every hidden expense.
- Tracking KPIs like attendance and engagement is essential to understanding why a specific webinar generated pipeline and how to optimize future webinars.
- You can extend the lifespan and ROI of your webinar by using AI tools to repurpose the recording into social clips and blog posts that drive ongoing sales.
Webinar ROI tells you whether your webinars are actually worth running or just burning budget.
The metrics that matter most tend to be tied to revenue, pipeline, and cost per lead.
In this guide, you'll learn how to calculate webinar ROI step by step. We’ll cover which KPIs actually move the needle, and how to get more return from every webinar.
What is webinar ROI?
Webinar ROI (return on investment) is the return you get from the time, budget, and effort you put into a webinar. It measures the success of your webinar against the total cost to produce and promote it.
The basic formula is:
Webinar ROI = [(Revenue generated – Webinar cost) / Webinar cost] x 100
Webinars can also drive pipeline influence, brand awareness, and customer education. So while the basic formula proves direct revenue, the true ROI on webinars can be felt beyond its immediate impact.
Why does webinar ROI matter?
Measuring webinar ROI matters because it shows whether your webinars actually help your business grow. If you don't measure webinar ROI, you are essentially unaware of whether your inputs actually produce results for your brand.
Here are some of the most important reasons to regularly measure your webinar ROI:
- Show which metrics actually matter: You might see high registration numbers, but vanity metrics don't always translate into actual revenue.
- Make better decisions: Once you know which KPIs (key performance indicators) affect ROI, you can start making data-driven decisions instead of guessing.
- Justify your marketing budget: Proving a positive ROI makes it much easier to secure funding and buy-in from leadership for future events.
- Compare marketing strategies: ROI makes it easier to compare webinars across different campaigns, platforms, channels, and audiences.
- Optimize your cost per lead: By understanding your total production costs, you can refine your strategy to acquire better leads for less investment.
How to calculate webinar ROI: Step by step
To measure webinar ROI accurately, you need to track the webinar metrics behind it.
Relevant KPIs include registration rate, attendance rate, engagement, webinar conversion rates, and many more. These give insights into how your webinars perform, from the promotion to the execution, and follow-up phase.
Let’s have a look at what KPIs you need to track to accurately measure your ROI.
Step 1: Track webinar revenue and leads generated
First, you need to determine what success looks like for your webinar because webinar ROI is not always about direct sales. Once you know what result you are measuring, you can choose the right KPIs and calculate ROI more accurately.
Here are a few examples of outcomes that may define what a “return” looks like for your business:
- Direct sales: Purchases made during or immediately after the webinar.
- Qualified leads: Attendees who match your ideal customer profile and enter your pipeline.
- Booked demos: Prospects who schedule a product walkthrough with your sales team.
- Customer renewals: Existing customers who renew, upgrade, or extend their contracts.
Once you know what outcome matters most, you need to assign a real dollar value to your results. To do that, track the following metrics right after the webinar as well as over a set time frame (e.g., 30 or 60 days after the event):
- Direct revenue generated: Purchases made during the live webinar or deals closed from your attendee list.
- Sales-qualified leads (SQLs): Attendees who fit your customer profile and are ready to speak with sales.
- Booked demos: High-intent prospects who move to the next sales stage.
- Estimated lead value: Leads or prospects that have not converted yet, but can be assigned a projected value based on historical data. For example, if 10% of webinar leads usually become customers, and the average customer is worth $1,000, each new lead has an estimated value of $100.
- Click-through rate (CTR): A supporting KPI that shows how many viewers clicked your CTA, offer, or resource link during the webinar. Normally, it’s not part of the return unless you connect those clicks to actual lead or revenue value.
Example: Turning webinar results into return value
Let’s say your webinar generated the following results:
- Direct sales during the webinar: 3 purchases at $500 each = $1,500.
- Booked demos: 10 demos, and historically each booked demo is worth $200 in expected revenue = $2,000.
- New qualified leads: 20 leads, and each lead has an estimated value of $100 = $2,000
Now add those together:
Total webinar return = $1,500 + $2,000 + $2,000 = $5,500
Now you have a concrete number to use in your final ROI calculation.
Pro tip: Compare your webinar ROI against other marketing channels. Regardless of its final cost, if your webinar's cost per lead is $25 and your paid ads cost $100 per lead, leadership will instantly recognize the value.
Step 2: Track webinar costs and expenses
To measure webinar ROI accurately, you need to track every cost tied to planning, promoting, running, and following up on the webinar.
This is where many teams get confused and end up ignoring the majority of actual expenses beyond ad spend and webinar software. If your in-house design team of 2 people must spend a full 8-hour day preparing your slides and landing page, that’s 16 hours of sunken costs. According to our research of 400+ data points, manually producing a webinar takes, on average, 16–35 hours.
Your total webinar cost should include everything required to make the event happen, such as:
- Webinar software: Your hosting, recording, streaming, or production platform.
- Speakers and guests: Speaker fees, prep time, or partner costs.
- Promotion costs: Paid ads, email campaigns, landing page design, and social promotion.
- Staff time: Time spent planning, preparing, rehearsing, running the event, and following up afterward.
- Production and editing: Video cleanup, clipping, repurposing, and post-production work.
- Other tools or services: Design tools, transcription, CRM workflows, or freelance support.
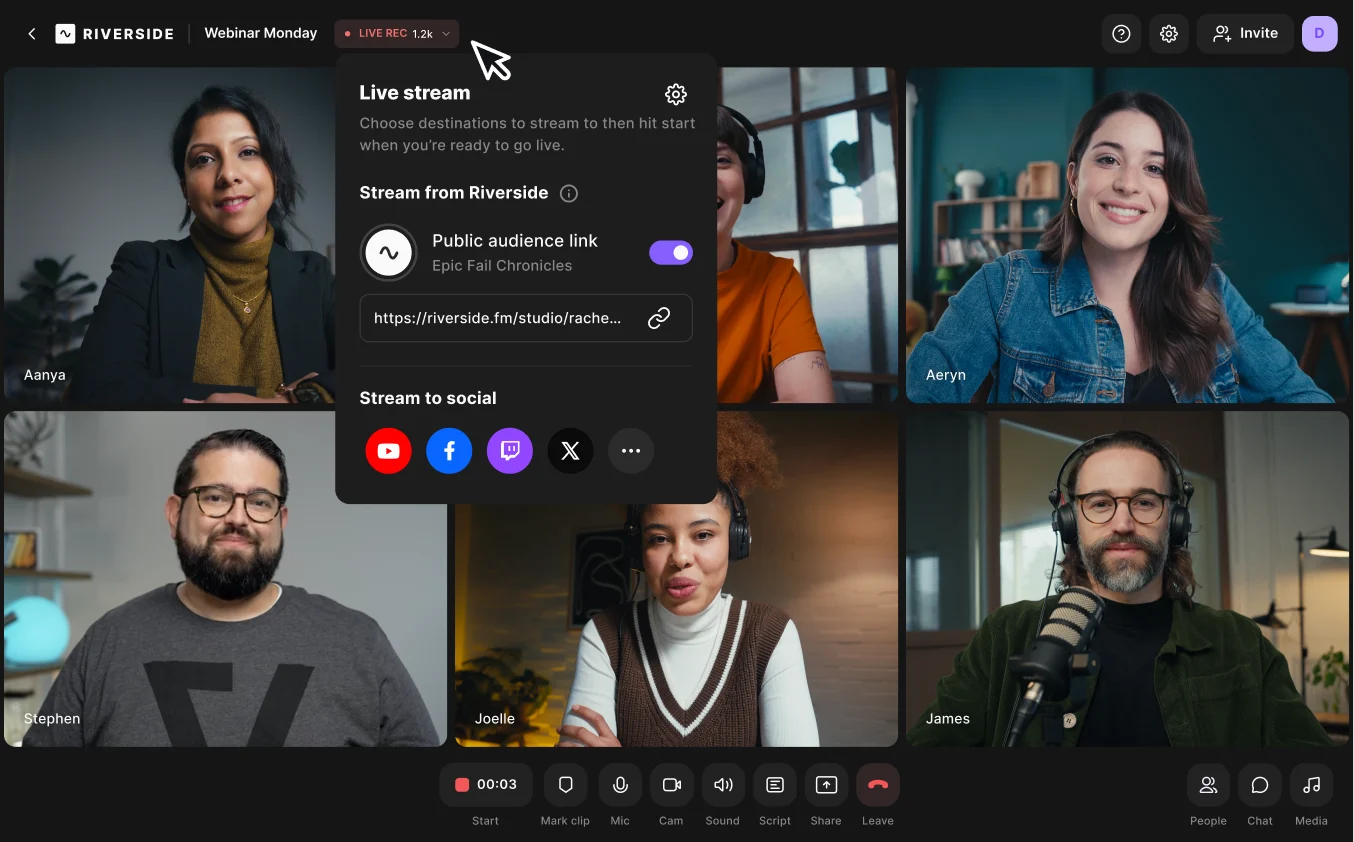
To save costs, it's worth using an all-in-one platform like Riverside. Riverside handles the hosting, recording, and editing in one place (and with no technical expertise necessary), so you don't need to buy expensive external software or hire freelance editors. Riverside can cut the time required to produce a webinar to just 3–6 hours. For a 3-person team, that’s 300–600 hours/year of reclaimed productive time, drastically reducing your staff time expenses.
Plus, with AI tools like Co-Creator and Magic Clips, you can repurpose your content in minutes, generating many additional assets from a single event. This can help you earn more webinar views, subscribers, and followers, which paves the way for higher ROI.
Example: Adding up total webinar costs
Let's stick with our previous example and calculate the total cost of the webinar:
- Webinar software: $100
- Paid promotion: $600
- Speaker fee: $500
- Staff time: Editing, planning, and preparing for a total of 12 hours at $50 per hour = $600
- Post-webinar editing and repurposing: 4 hours of freelance work at $100 per hour = $400
Now add them together:
Total webinar cost = $100 + $600 + $500 + $600 + $400 = $2,200
Alternatively, consider how you could slash these costs by just using Riverside to wrap up editing, scheduling, and repurposing in minutes instead of hours:
- Webinar software (Riverside): $79 (per month)
- Paid promotion: $600
- Speaker fee: $500
- Staff time: Editing, planning, and preparing for a total of 6 hours at $50 per hour = $300
- Post-webinar editing and repurposing: 1 hour of in-house work at $50 per hour = $50
Total webinar cost (with Riverside) = $79 + $600 + $500 + $300 + $50 = $1,529
That’s almost $700 dollars less!
Step 3: Calculate your webinar ROI
Once you know your total return and total webinar cost, you can finally calculate your webinar ROI.
As a reminder, the formula to calculate your webinar ROI is:
Webinar ROI = [(Revenue generated - Webinar cost) / Webinar cost] x 100
Following our previous example, we have:
- Total webinar return: $5,500
- Total webinar cost: $2,200 (or $1,529 with Riverside)
Webinar ROI = (($5,500 - $2,200) / $2,200) x 100 = +150%
Or, with Riverside:
Webinar ROI = (($5,500 - $1,529) / $1,529) x 100 = +259.7%
That means the webinar generated about 1.5 times the amount invested (on top of covering its original cost), or 2.6 times its cost using Riverside.
Calculating the cost per qualified lead
Beyond overall ROI, calculating your cost per qualified lead is another highly effective way to measure success. It tells you exactly how much you pay to get a single prospect into your pipeline.
Here’s the formula:
Cost per qualified lead = Total cost / Number of SQLs
From our earlier example, the webinar generated 20 qualified leads.
$2,200 / 20 = $110 per qualified lead
Or, with Riverside:
$1,529 / 20 = $76.5 per qualified lead
So your cost per qualified lead is $110, or just $76.5 if you’re using Riverside.
Step 4: Consider other important webinar KPIs that influence ROI
Not every webinar KPI goes directly into your ROI formula, but many of them contribute to making your webinar more successful.
Some metrics contribute to sales months down the line by boosting brand recognition or building a loyal community. Others (like attendance and engagement) can tell you why one webinar generated more pipeline than another.
To get the full picture of your performance, track the following webinar KPIs.
Attendee webinar analytics
Registration and attendance rate have a massive impact on your final ROI.
Imagine you spend $500 on ads to get 100 registrants. If only 20 show up, your cost per live attendee is $25.
But if you send better reminder emails and get 50 people to show up, that cost drops to just $10. You instantly maximize your budget before the broadcast even begins.
Let’s examine these KPIs in more detail:
Registration rate
This is the total number of registrants who signed up for the webinar.
Why it’s important: This KPI measures the effectiveness of your marketing and copy. A high registration rate indicates strong interest in the topic and/or speakers.
Registration-to-attendee ratio
Also known as attendance rate, this metric compares the number of attendees to the number of registrants. In other words, it tells you how many registrants actually show up to the live event. The average attendance rate is about 40% of registrants, with 45%-55% considered as a strong result.
Why it’s important: Attendance rate helps you understand the level of commitment and interest among registrants. Improve it by carefully timing your webinar to your audience’s preferences, and by sending automatic follow-ups and reminders (which is easy to do on Riverside).
Audience engagement and interaction
Engagement is one of the best indicators of webinar revenue. Attendees who didn’t actively participate during a webinar have a mere 20% CTA click-through rate. This percentage spikes to 70% among attendees with at least 5-10 reactions, showing how participation can pave the way for increased conversions.
When you keep attendees actively involved, they are much more likely to trust you and buy from you.
Average viewing time
This measures the average amount of time attendees spend watching the webinar. The longer your audience watches, the more likely they are to engage.
Why it’s important: If the webinar content isn’t interesting or doesn’t meet audience expectations, viewers will drop off before it ends. This metric mainly reflects the value of the content and how well the speaker(s) keep people interested.
Audience participation and engagement rate
This tracks the percentage of attendees who engage with the webinar through questions, polls, chats, or other interactive elements.
Why it’s important: Reactions and interactions show whether your audience is actively involved or just sitting there. High participation rates often correlate with higher satisfaction, retention, and click-through rates.
Satisfaction rate and feedback score
This metric tracks how satisfied the attendees were with the webinar. Feedback surveys or polls after the webinar can help you calculate this rate.
Why it’s important: Satisfaction rate can help you understand how helpful and entertaining the webinar was for the audience. If you get bad feedback on a webinar, don’t sweat it: just use the feedback gained to improve on future events.
On-demand downloads and replays
On-demand downloads and replays count how many times people watch the recorded version of the webinar.
Why it’s important: This metric is useful for understanding the evergreen value of your content. If the video is replayed multiple times by a large audience, then your webinar can keep increasing its ROI over time well beyond its initial cost.
Follow-up engagement rate
Follow-up engagement rate measures how much your audience responds to the follow-up emails you send after the webinar.
Why it’s important: If your audience still shows interest in your brand/webinar after the ‘high’ of it wears down, that means they’re more inclined to purchase your product or service.
Example: How improving KPIs can increase webinar ROI
Let’s go back to our example webinar, which had the following stats:
- Return: $5,500
- Cost: $2,200
- ROI: 150%
- Live attendees: 100
- CTA click rate: 20%
- Estimated lead value: $100 per lead
With no engagement and a CTA click rate of 20%, only 20 attendees might click your offer. With an estimated lead value of $100, this means your expected pipeline value is:
20 x $100 = $2,000
Now, let’s say you improve audience participation with Riverside by adding live call-ins, polls, Q&A, and chat.
Your CTA click rate is more likely to rise from 20% to 70%, increasing your leads from 20 to 70.
Now the same webinar gets:
70 x $100 = $7,000
That is $5,000 more return ($7,000 - $2,000) from the same webinar, without increasing webinar cost.
Now let’s recalculate ROI:
New total return (with increased engagement) = $5,500 + $5,000 = $10,500
ROI (with Riverside) = (($10,500 - $2,200) / $2,200) x 100 = 377%
So by improving just a single KPI (audience engagement), you could increase webinar ROI from 150% to 377%. This means your ROI can increase by +227 points, not bad!
Pro tip: Connect your webinar platform directly to your CRM to set a clear attribution window to prove which attendees turned into paying customers months down the line. You can plug Riverside to HubSpot and SalesForce with a click.
How to maximize webinar ROI

As we already mentioned, you can drastically increase your webinar ROI by optimizing just a few key stages.
Here are the most effective ways to maximize your results:
Target high-intent audiences: Focus your promotion on prospects that actively need your solution. A smaller audience you made curious about a niche topic always converts better than a large, uninterested crowd.
Increase your show-up rate: People usually miss webinars because of inconvenient timing or because they forget about it. You can boost attendance by sending calendar holds and automated reminder emails. Riverside does this automatically!
Improve webinar conversion rates: Don't wait until the very last minute to make your pitch. Do it while attention is still high, and actively repeat your CTA. Keep people engaged with polls, chat, and Q&As. With Riverside, you can use live call-ins to answer hesitant buyers’ questions face-to-face.
Retarget no-shows and attendees: Send targeted follow-up email sequences, launch retargeting ads, and have your sales team directly reach out to your most engaged attendees. On Riverside, you can sync all your prospects’ data in your CRM with a click.
Repurpose the webinar to extend its lifespan: Your webinar doesn't need to end when you stop broadcasting. You can turn it into months of marketing material. Just chat with Riverside's Co-Creator to automatically generate blog posts, email newsletters, short clips, and social media assets directly from your recordings.
Webinar ROI FAQs
What is a good ROI for webinars?
A good ROI for webinars is usually 100% or more, meaning the webinar generated at least double what it cost.
Over 200% is a strong result, since you’ve earned 3 dollars for every dollar you spent.
Still, the real benchmark varies by industry, sales cycle, and whether your webinar will continue to produce value once it’s over (through repurposing, clips, on-demand content, etc).
How do webinar benchmarks compare across different industries?
Webinar performance can vary dramatically by industry. Some sectors see higher live attendance but lower conversions, so the same KPIs can tell very different stories depending on the audience.
Here’s how webinar funnels typically compare across different industries:
- Pharmaceutical and healthcare: This sector sees incredibly high participation, but a cautious approach to decision-making. Pharmaceutical webinars can hit a 63% attendance rate but only 1.5% attendee-to-customer conversion rate.
- Software and SaaS: Attendance rates in software and IT services vary a lot, ranging from 28% to 57%. However, average engagement time is quite long at 51 minutes, showing how B2B webinar audiences will stay engaged when the topic is relevant. This means that in this industry, the more narrow and targeted your topic is, the better your results will be.
- Financial services: Financial audiences are highly active during broadcasts. The average number of unique interactions per webinar approaches 300. Attendees are also very reactive to CTAs, which drives stronger pipeline movement than in other sectors (15% conversion rate to sales meetings).
- Advertising: This is one of the weaker industries for live webinar attendance with just a 33% registrant-to-attendee ratio, and a meager 1.2% attendee-to-customer conversion rate. Audiences often sign up for webinars just to learn new tactics or spy on competitors. In other words, don’t feel bad if your numbers look low!
What is a good show-up rate for a webinar?
A good show-up rate for a webinar is between 35% and 45%, but it can vary depending on your niche, audience, and webinar type.
For example, the pharmaceutical industry sees webinar attendance rates of 63%, while the advertising industry barely reaches 33%. You can easily boost this number by sending automated calendar holds and reminder emails leading up to the event.
How can I analyze feedback from webinar attendees?
You can analyze feedback from webinar attendees by sending a short post-webinar survey and tracking audience engagement metrics.
Check metrics like viewer drop-off points, poll responses, and chat or Q&A transcripts. These insights show which topics resonated with attendees and where viewers lost interest. For example, if highly engaged attendees loved the content but low-intent attendees dropped off early, the issue may be targeting rather than presentation quality.
Are webinars profitable?
Yes, webinars can be profitable when they generate more value than they cost.
That value may come from direct sales, sales-qualified leads, booked demos, renewals, influenced pipeline, or on-demand conversions after the event.
You can increase this profitability by repurposing your webinar recording into short-form clips and social posts that drive ongoing sales.


.webp)
.webp)

